
MFA Project work at SVA // Data Visualization + Prototyping
The MTA collect an array of detailed data on subway transit, but to date the organization has not found a way to utilize data visualization as part of their internal communications. SVA IxD ran a workshop where participants were tasked with creatively visualizing some of this existing data, to demonstrate what's possible and hopefully help inspire change within the organization.
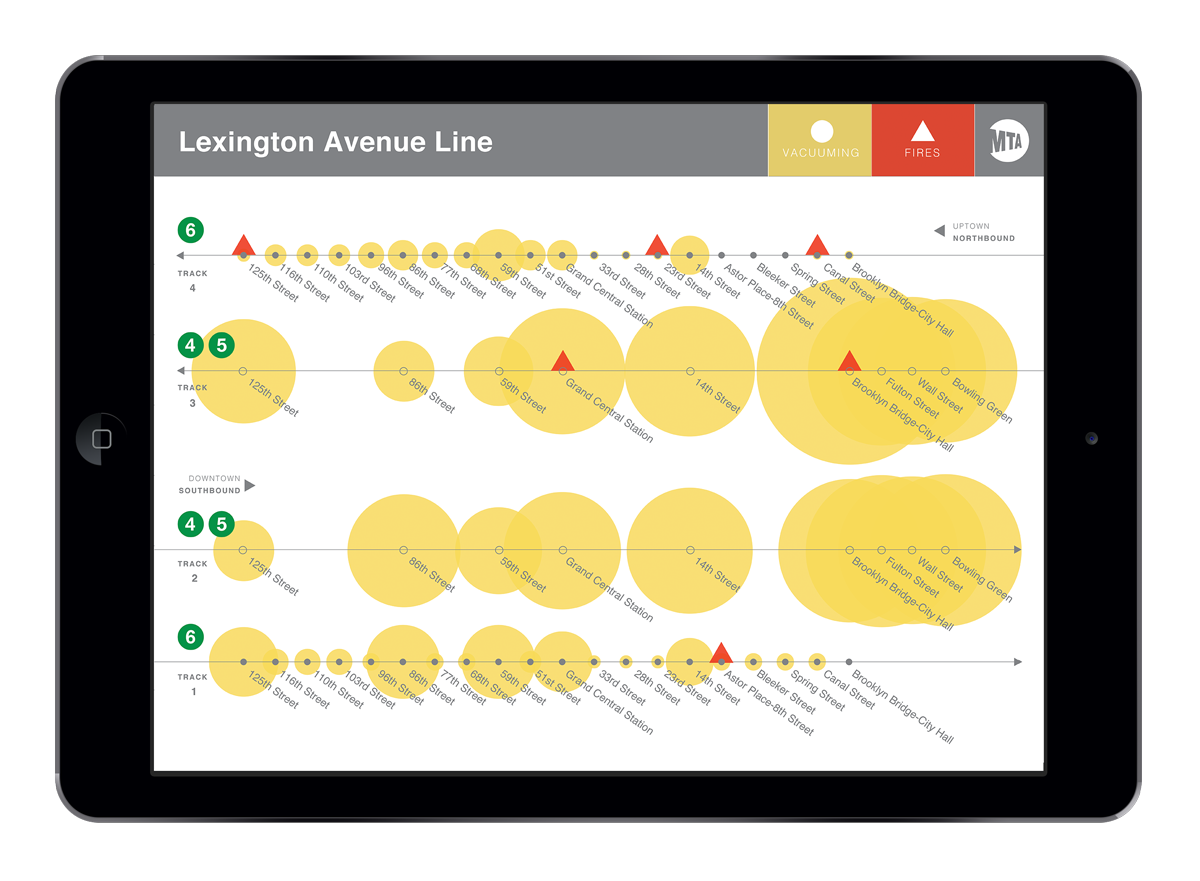
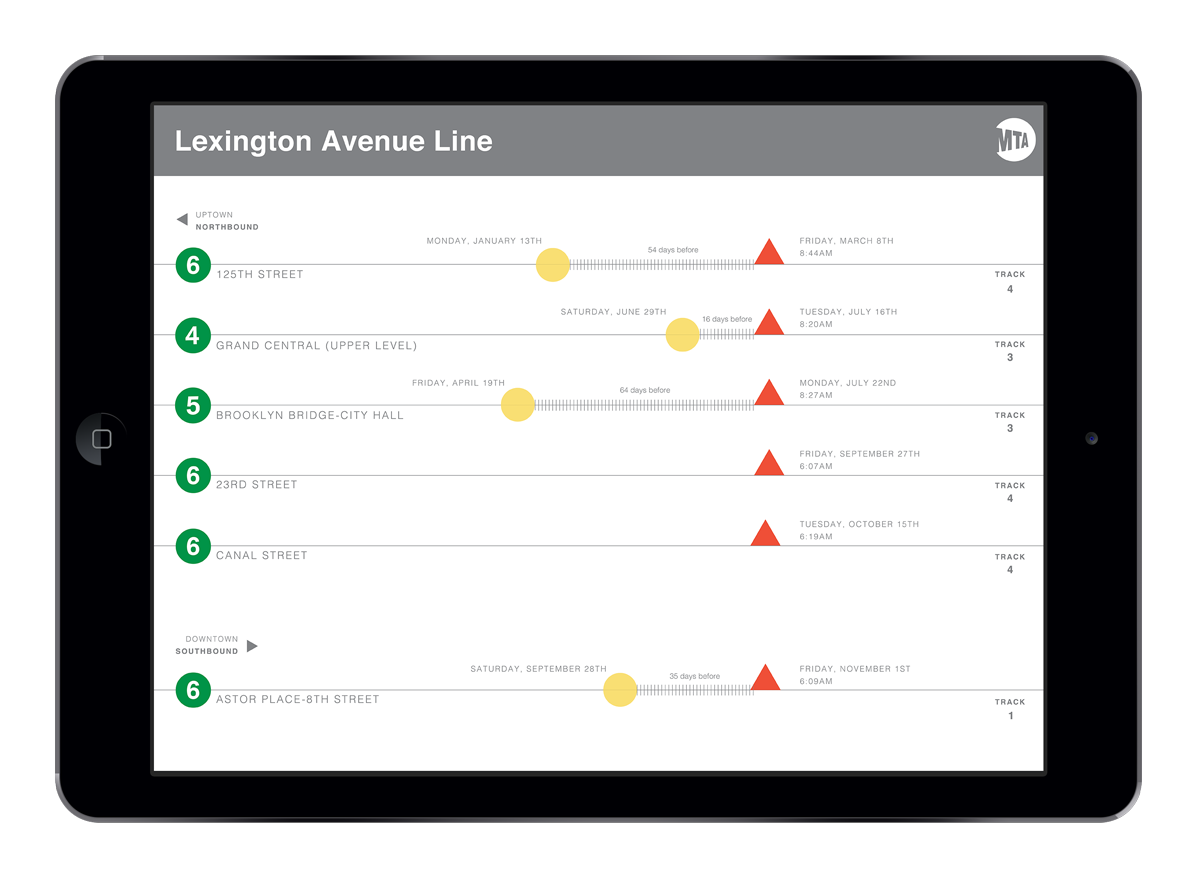
My group looked specifically at fires on subway tracks.
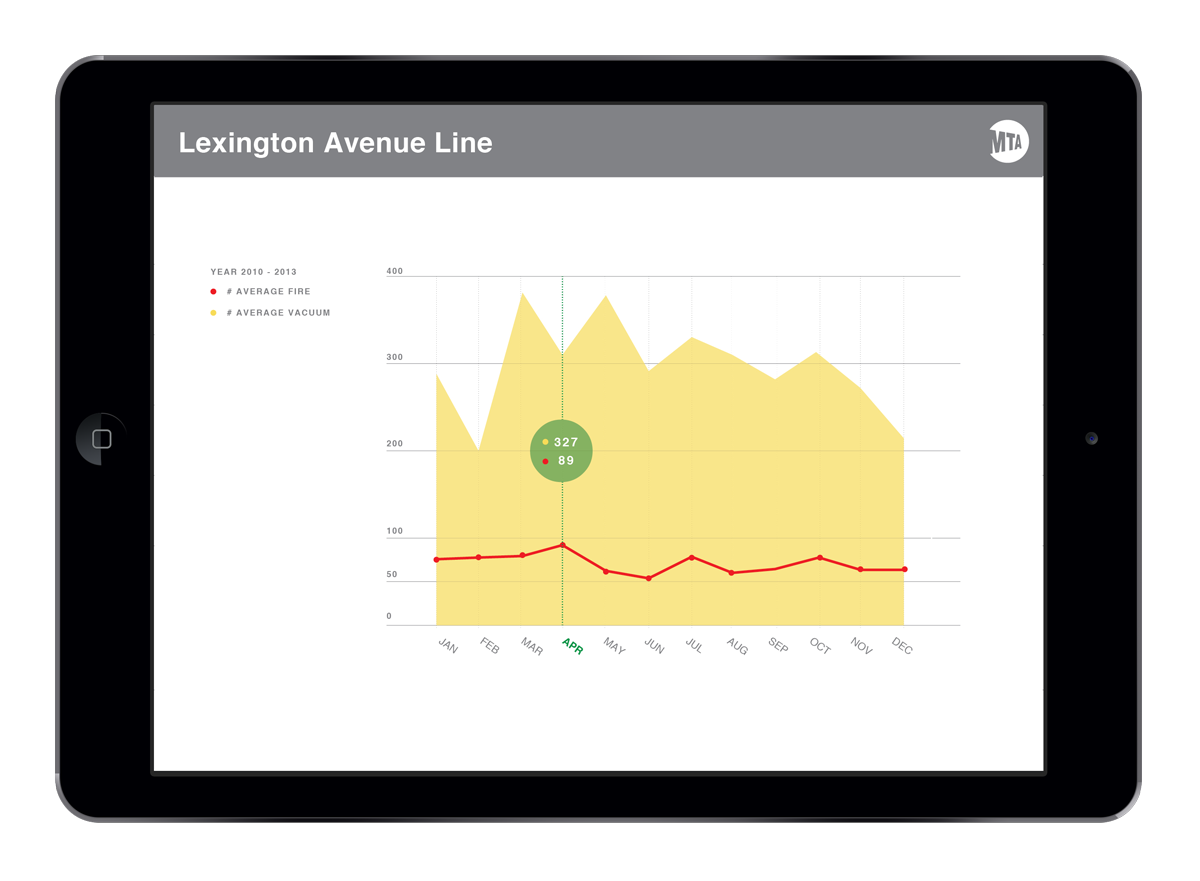
We would look at the frequency with which fires took place, and try to identify possible causes. A known cause of fires is trash on the track, so one area of particular interest was how often cleaning took place (with Vacuum Trains).
Data examined included: the total number of monthly fires across the whole subway system, Vacuum Train activity (across one line), and delays during morning rush hour (also on one line only).
Along with the visualizations themselves, we delivered an interactive iPad prototype (built using Framer.js) which afforded the MTA team a chance to see how the visualizations might be used in the context of their board meetings.
Our hunch was that stations with more frequent vacuuming would see less fires, since less trash would be left on the tracks.
Unfortunately, the very limited data set did not conclusively support this. However, the visualizations set up a language and format where identifying such connections would be possible. If no connection is found with more data, the visualizations would help redirect attention towards other possible causes.
Our thinking and deliverables were very well received by the team present in the final workshop.
Collabaration with Amy Wu and Hanna Yoon.